
Blog
The “Lower High” Trap: Why Your Daily Chart is Lying to You
Stop Being “Liquidity”: The Mathematical Blueprint to Engineering Alpha
The Hard Truth
Let’s be brutally honest. 90% of the people reading this blog are not “traders.” They are liquidity.
They enter the market, glance at a 15-minute chart, see a green candle, and hit “Buy.” Unknowingly, they are providing the exit liquidity for the institutions that bought three weeks ago.
If you want to stop being the victim of the market and start being the architect of your own alpha, you need to stop guessing. You need to start engineering your trades.
I promised to share the blueprint. This is it. This is how you move from “Retail Gambler” to “Professional Risk Manager.”
Part 1: The X-Ray Vision
MULTI-TIME FRAME ANALYSIS
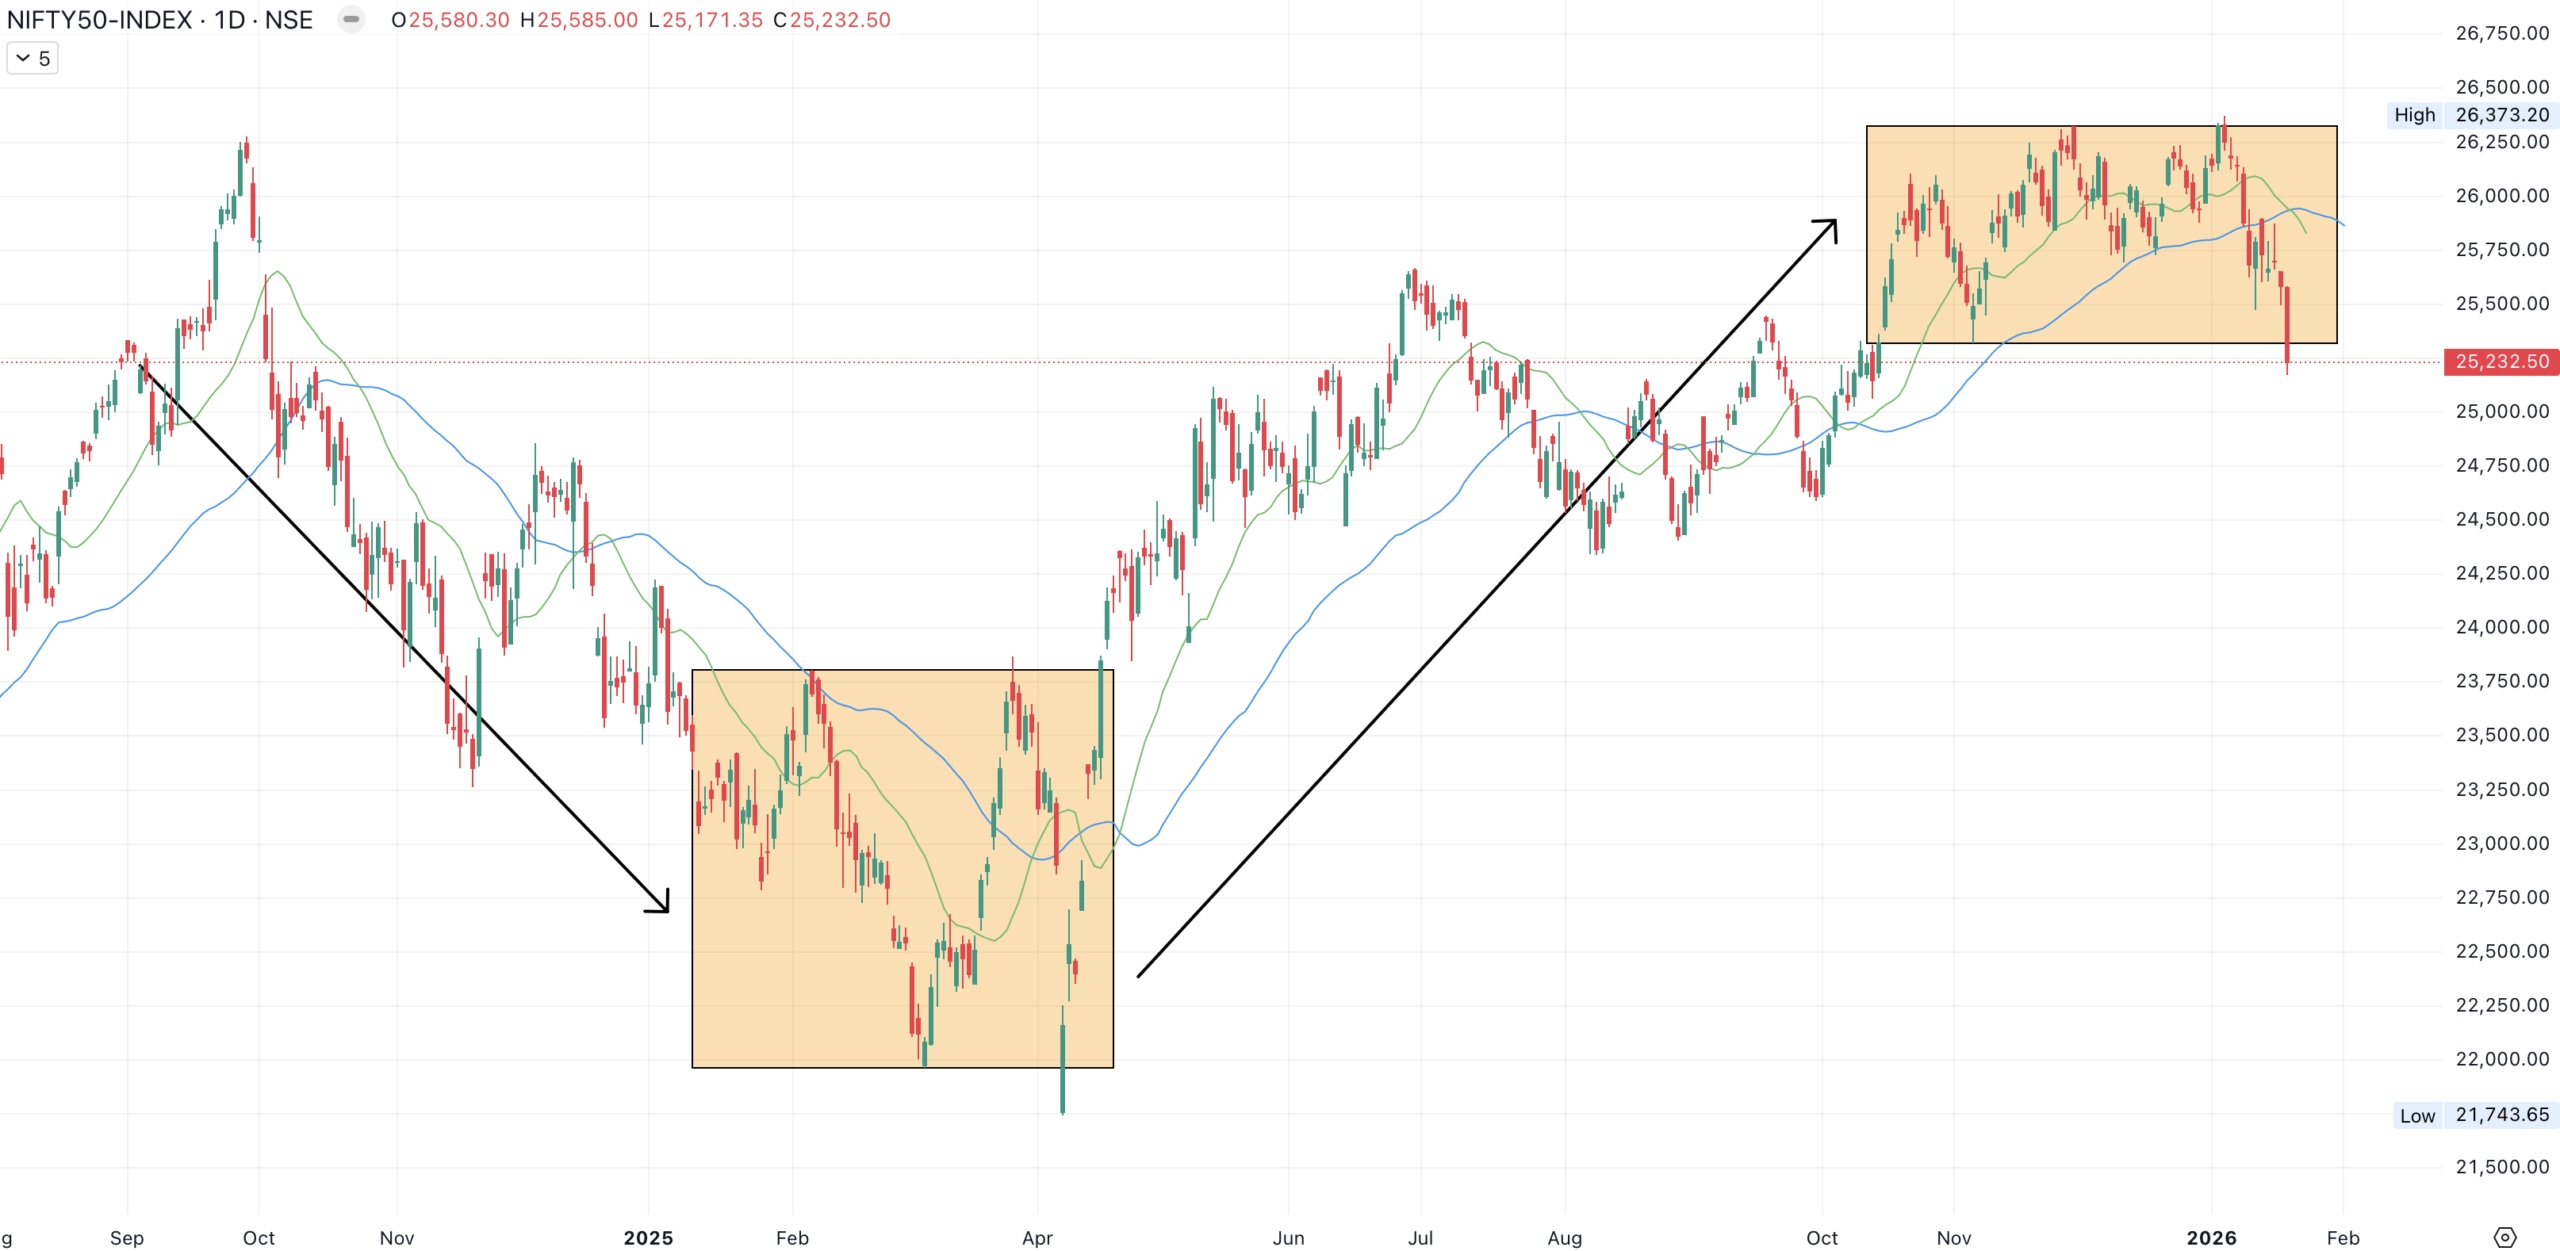
The single biggest reason traders fail is Myopia—being nearsighted.
You look at the Daily chart, and you see a stock at “Support.” You buy. It crashes. Why? Because while the Daily chart said “Buy,” the Monthly chart screamed “Sell.”
MTFA (Multi-Time Frame Analysis) is not a suggestion; it is a survival requirement. Here is the Professional Dashboard you must adopt:
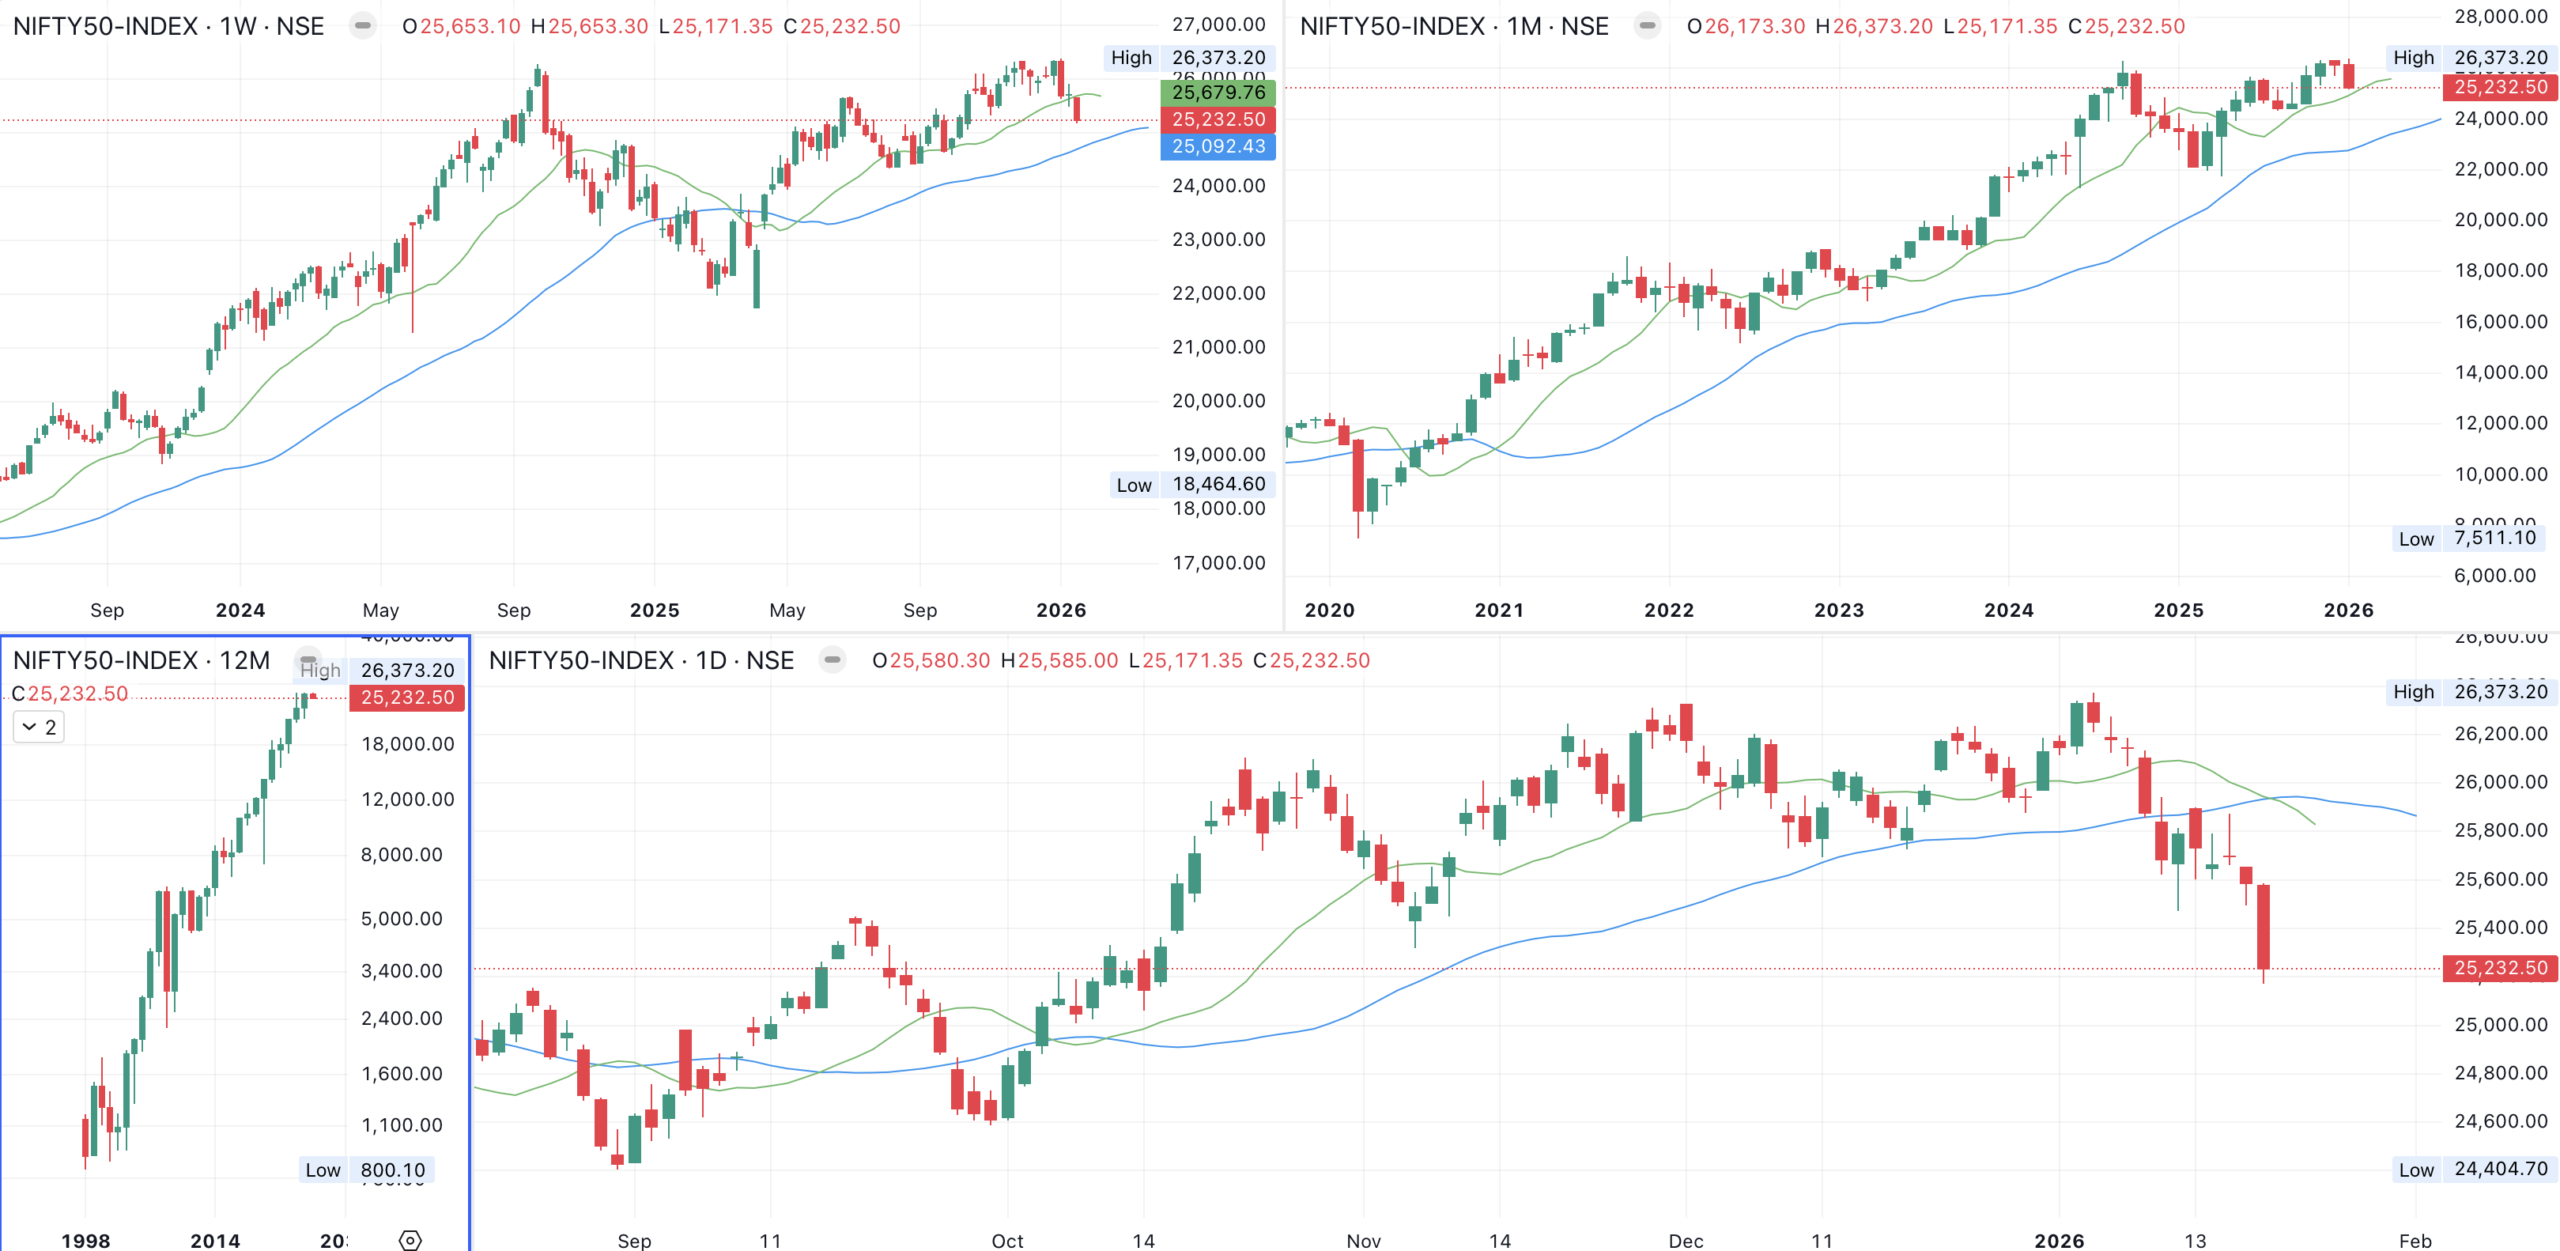 Fig 1.1: Alignment of Yearly, Monthly, and Weekly Trends
⚠️ The Golden Rule
When the Daily Timeframe fights the Monthly Timeframe, the Monthly almost always wins.
If you buy a Daily support that sits under a Monthly resistance, you are walking into a kill zone.
Part 2: The Filter
HPTS VS LPTS
Amateurs look for “trades.” Professionals look for probabilities.
We categorize every setup into two buckets:
🟢 HPTS (High Probable Trade Setup): All time frames are aligned. The “Tide,” “Wave,” and “Ripple” are moving together. The risk is low; the math is on your side.
🔴 LPTS (Low Probable Trade Setup): The time frames are in conflict.
Part 3: The Cheat Sheet
| Feature | The Amateur (Gambler) | The Professional (Casino) |
|---|---|---|
| Primary Focus | “How much money can I make?” | “How much money can I lose?” |
| Market View | Looks for Predictions. | Looks for Structure. |
| Reaction to Loss | Averages down (adds to losers). | Hedges or Cuts (Manages risk). |
| Chart Usage | 15-min / Daily (Nearsighted). | Monthly / Weekly (X-Ray Vision). |
| When Wrong | Panics and Hopes. | Adjusts and Insures. |
Part 4: Stop Committing These 3 Sins
If you have blown an account, it was likely due to one of these three sins.
You buy because “It has been a market leader for 30 years.”
The Reality: The market has no memory and no loyalty. A 22% CAGR history does not protect you from a 40% future drawdown. We trade the chart, not the legacy.
You buy at 100. It falls to 80. You buy more to “lower your average.” It falls to 60.
The Reality: You are adding weight to a sinking ship. Professionals never average down on a losing trade unless they are Hedging.
You buy a Future or a large quantity of equity without insurance.
The Reality: A Pro never leaves a position exposed. If we are caught in a drawdown, we do not panic-sell. We Hedge.
🛡️ How to Hedge (The Simple Version):
- Identify the structural breakdown.
- Sell Call Options (Covered Calls) against your equity.
- Generate income while the stock falls.
- We use the market’s money to insure our own risk.
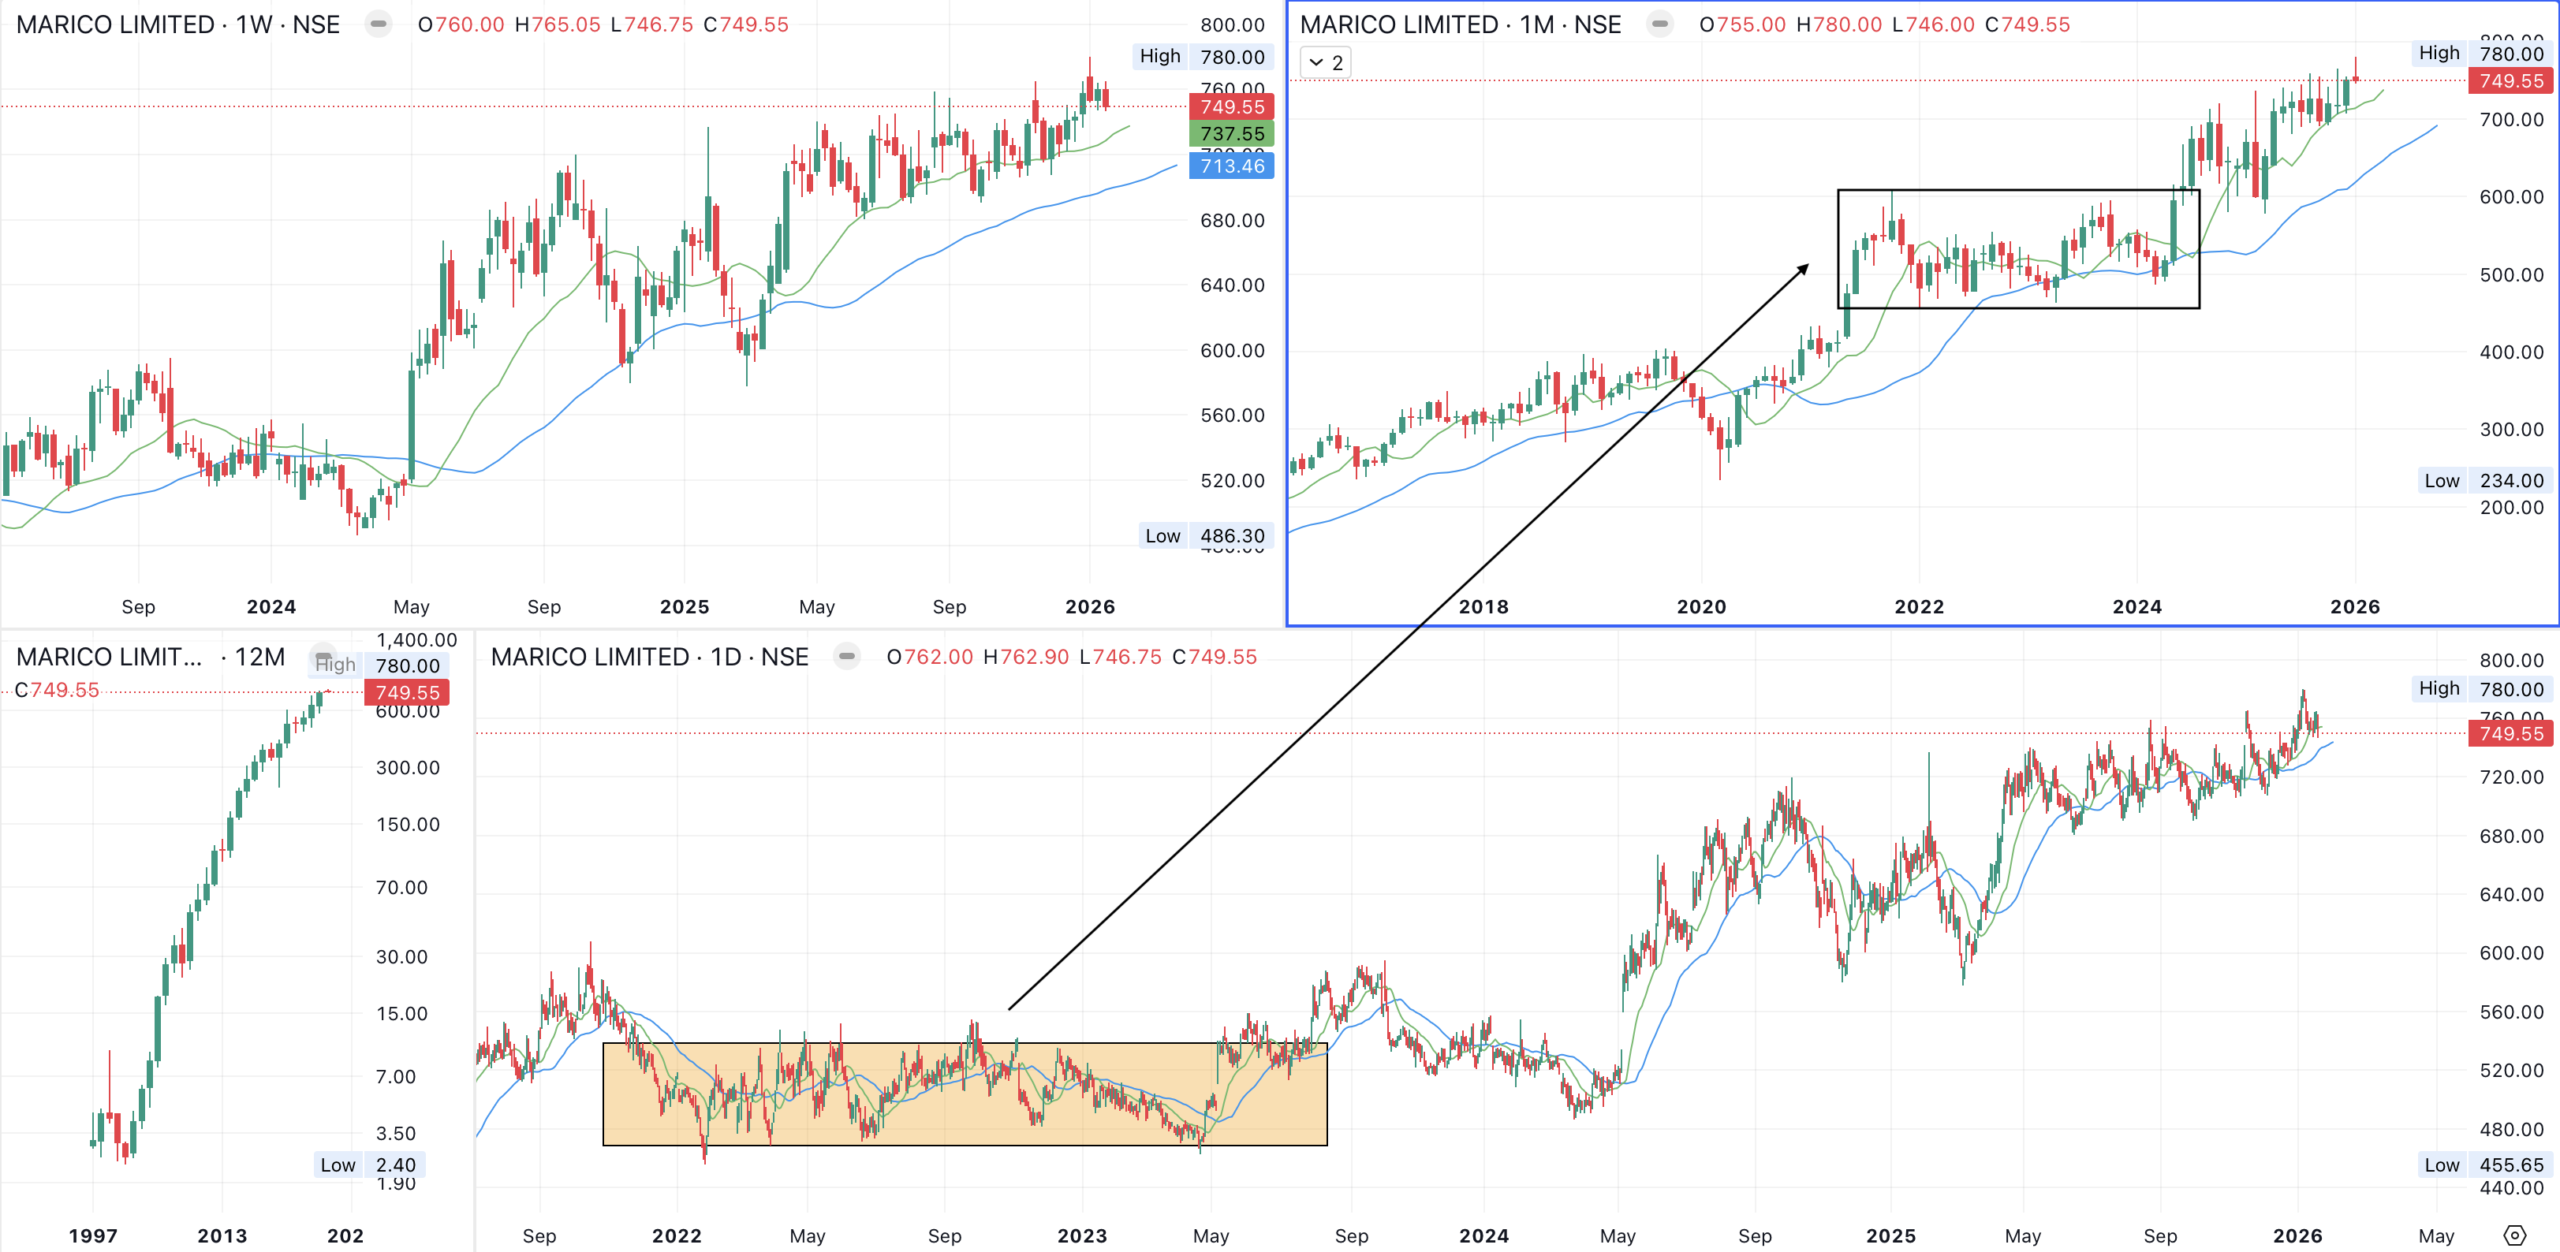 Fig 1.3: Generating Income During Drawdowns
The Verdict: Become the Casino, Not the Gambler
Becoming a pro trader is not about finding a “magic indicator.” It is about Structure.
It is about having the discipline to wait for the Monthly and Daily charts to agree. It is about accepting that a “Lower High” is a stop sign, no matter how much you love the company.
It is about realizing that “Prediction” is for amateurs. Risk Management is for professionals.
You now have the map. The question is, do you have the discipline to follow it?
📉 Don’t Settle for Average Growth.
HDFC gives you stability. We give you Financial Freedom.
- ✅ Algo Execution: Zero emotions, 100% discipline.
- ✅ Nifty + Gold: The ultimate hedge strategy.
- ✅ Passive Wealth: No screen time required.
Join The 17% Club
UNLOCK THE STRATEGY ➔Start compounding your wealth today.