
The GMA – Backtest
Gold Mini – The GMA Strategy (Backtest Report)
GOLDM · MCX · 2015–2025
Abs Return: ~2838–2855%
CAGR (Approx.): ~37% p.a.
Max DD: ₹1,09,790›
Backtested on MCX Gold Mini (GOLDM) from 02 Mar 2015 to 21 Nov 2025 (approx. 10.7 years). This dashboard summarises how the GMA strategy behaved in this historical period.
1. Equity Curve – Profit Growth Over Time
Profit Curve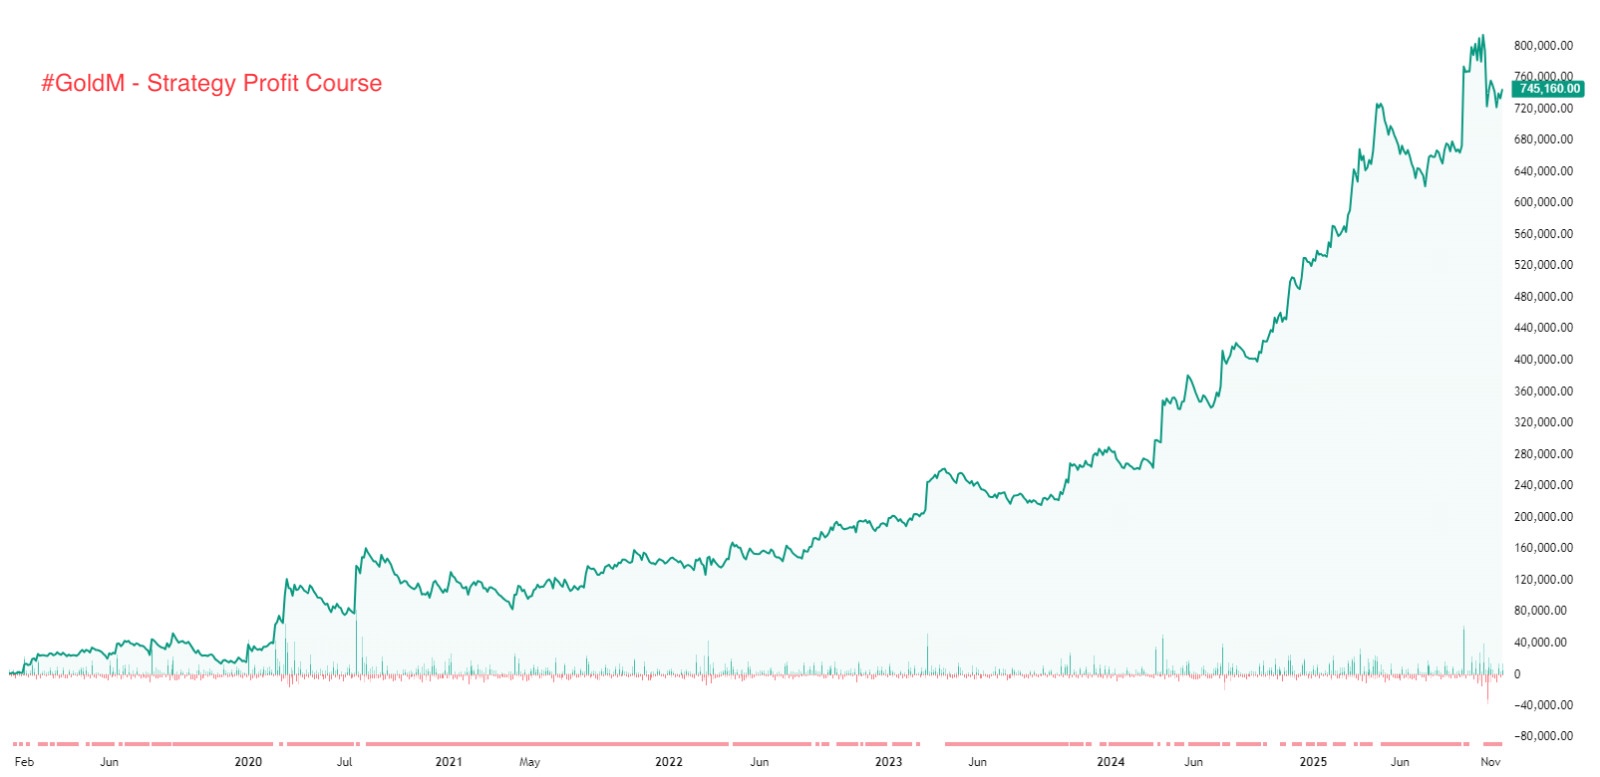
2. Investment & Return Profile
Capital & Growth| Metric | Value |
|---|---|
| Initial Capital (Approx.) | ₹26,000 |
| Total Profit (Backtested) | ₹7,37,950 |
| Final Value (Approx.) | ₹7,63,950 |
| Absolute Return (Approx.) | ~2838% on initial capital |
| CAGR (Approx.) | ~37% per year |
| Trade Accuracy | Below 50% |
3. Year-wise Profit Breakdown (Approx.)
Annual P&L| Year | Profit / Loss (₹) |
|---|---|
| 2015 | 28,130.00 |
| 2016 | -10,000.00 |
| 2017 | 4,710.00 |
| 2018 | -1,400.00 |
| 2019 | 18,830.00 |
| 2020 | 89,620.00 |
| 2021 | 37,420.00 |
| 2022 | 46,120.00 |
| 2023 | 1,00,520.00 |
| 2024 | 2,30,710.00 |
| 2025 | 1,97,690.00 |
| Grand Total | ₹7,42,350.00 |
The year-wise matrix helps understand how profits are distributed across time – strong years, weak years, and periods of consolidation. Values are approximate and represent backtested performance, not live trades.
4. Risk & Drawdown Behaviour
Risk Profile| Metric | Value |
|---|---|
| Max Drawdown (Approx.) | ₹1,09,790 |
| Max Contracts Held | 1 (Gold Mini lot) |
| Risk Behaviour | Deep but historically recoverable drawdowns within the tested period. |
| Volatility Profile | High – both large winning and losing phases on the equity curve. |
5. Trade-Level Performance Snapshot
Per-Trade Stats| Metric | Value |
|---|---|
| Average P&L per Trade | ₹608.37 |
| Average Winning Trade | ₹5,833.29 |
| Average Losing Trade | ₹3,002.14 |
| Win / Loss Ratio (Avg) | 1.94 |
| Largest Winning Trade | ₹1,01,170.00 |
| Largest Losing Trade | ₹70,600.00 |
6. Key Educational Observations
For Learning OnlyThese points are shared only to help understand how this backtested strategy behaved on Gold Mini (GOLDM):
- Backtested equity growth is non-linear – a mix of trending phases, sideways periods, and drawdowns.
- Some years are strongly positive (e.g., 2020, 2023, 2024, 2025), while others are flat or negative – which is normal in real market cycles.
- Max drawdown figures remind that risk and volatility remain an integral part of any leveraged strategy.
- Edge appears to come from capturing large moves in Gold Mini while keeping average losses relatively controlled.
- This report is best treated as a case study in backtest behaviour, not as a guarantee of live results.
7. Educational Summary
System BehaviourThe Gold Mini – GMA Strategy backtest illustrates how a rule-based framework on GOLDM futures can create long-term equity growth on paper through risk–reward optimisation and trend participation. It also highlights the reality of deep drawdowns, uneven yearly returns, and psychological pressure that come with such systems. These numbers are purely historical and hypothetical, based on specific assumptions and data sources. They are not a forecast, promise, or guarantee.
Eagle SIP Turbo – Daily Stock SIP (Marico)
Equity · Wealth Creation · Backtest
Final Value: ₹1,32,60,488
Invested: ₹22,50,235.20
Abs Return: ≈ 489.30%›
Eagle SIP Turbo is a daily stock SIP, proprietary condition-based wealth creation strategy on Marico. It focuses on systematic accumulation during weakness and momentum confirmation, rather than fixed-date, fixed-amount SIP.
1. Equity Curve – Eagle SIP Turbo Profit Growth
Profit Curve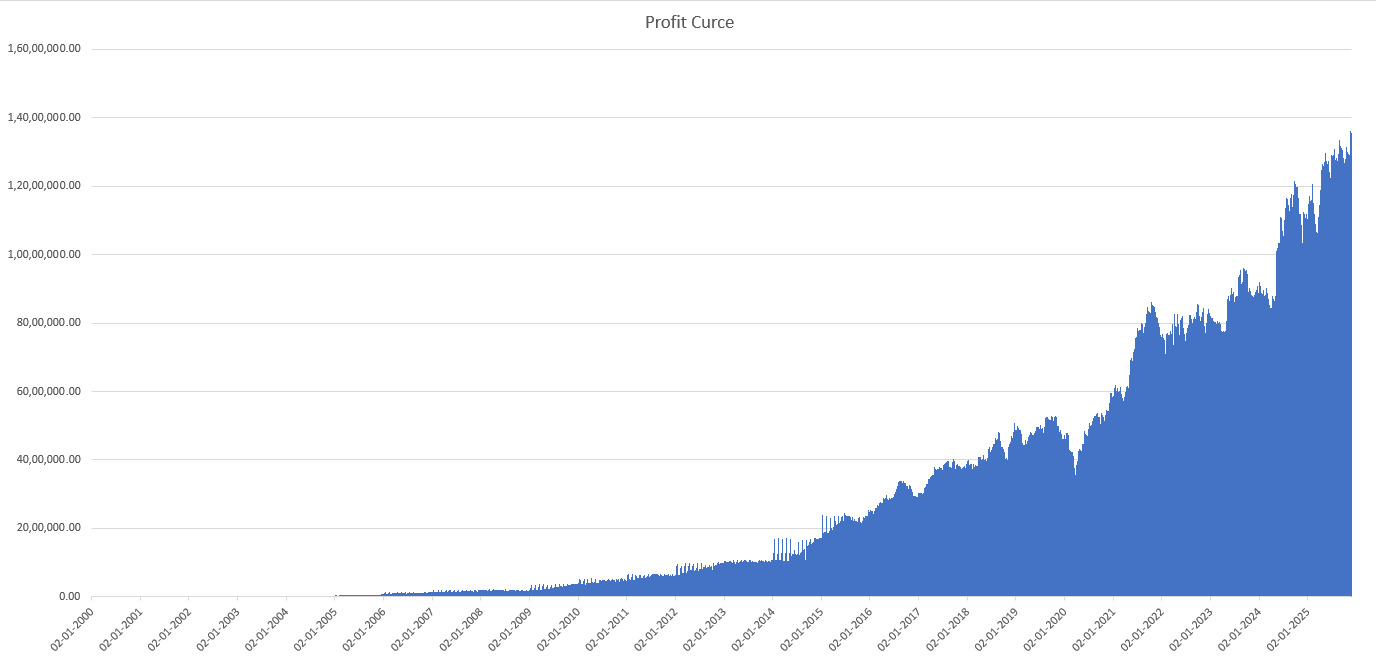
2. Investment & Accumulation Profile
Capital & Units| Metric | Value |
|---|---|
| Total Amount Invested | ₹22,50,235.20 |
| Final Portfolio Value | ₹1,32,60,488 |
| Total Profit (Unrealised + Realised) | ≈ ₹1,10,10,252.80 |
| Absolute Return (Approx.) | ≈ 489.30% |
| Total SIP Buy Events | 6,030 |
| Total Shares Accumulated | 17,922 |
Current Price Used ≈ ₹737.90
This gap highlights how disciplined accumulation during dips can reduce average cost and build a meaningful buffer in favourable long-term trends.
3. Risk & Portfolio Drawdown Behaviour
Risk Profile| Metric | Value |
|---|---|
| Largest Portfolio Decline from Peak (Approx.) | ≈ ₹19,39,740 |
| Biggest 1-Day Loss in Valuation | ₹7,40,505.15 |
| Biggest 1-Day Gain in Valuation | ₹9,03,123.20 |
| Volatility Behaviour | Multiple deep corrections during market stress phases. |
| Exposure Style | Always invested; allocation increases when conditions favour accumulation. |
4. Strategy Logic – Primary & Proprietary Conditions
How Eagle SIP Turbo AccumulatesEagle SIP Turbo does not buy a fixed amount daily. It accumulates more aggressively when price and data meet specific conditions:
- 1. Below Previous Day’s Low: Fresh accumulation only when the stock is trading below the previous day’s low – focusing on weakness, not strength.
- 2. Intraday Fall > 2%: Additional buying when intraday decline crosses –2%, to use deeper dips more aggressively.
- 3. Below 21 DSMA: Accumulate more when price trades below the 21-day SMA – short-term weakness zone.
- 4. Below 55 DSMA: Accumulate more when price trades below the 55-day SMA – intermediate weakness zone.
- 5. Below 233 DSMA: Accumulate more below the 233-day SMA – long-term weakness / value zone area.
- 6. Proprietary Momentum Condition (Internal Engine): An additional proprietary momentum filter allows extra accumulation only when momentum turns in favour. Exact logic is not shared publicly; the engine handles this internally.
- 7. Proprietary Data-Bank Condition (Super Accumulation Zones): A data-bank driven, proprietary confirmation helps identify roughly ~20% “super accumulation” zones in the backtest. In internal studies, this helped the framework deliver approximately 10–20% better results vs basic, open SIP/averaging ideas. This is not a guarantee – it is an internal observation from backtested behaviour.
All proprietary checks (points 6 & 7) are executed by the Eagle SIP Turbo engine. They are not disclosed but are always applied in the background whenever the strategy runs.
5. What Makes Eagle SIP Turbo Different?
Hooks & Advantages (Educational)- Not a calendar SIP: It doesn’t buy just because it’s a date – it buys when price and data agree.
- Weakness-friendly: Designed to accumulate more when the stock is under pressure, not when it is already running.
- Layered logic: Combines price levels, moving averages and proprietary momentum/data-bank checks.
- Focus on super-accumulation zones: Attempts to concentrate buying where historical data shows higher long-term reward potential.
- Exit freedom: Strategy focuses only on entry and accumulation. Exit is kept flexible for the investor’s goals and comfort.
6. Educational Summary
System BehaviourThe Eagle SIP Turbo backtest on Marico shows how a rule-based, condition-driven SIP framework can behave over a long period. It uses weakness, moving average zones and proprietary confirmations to decide when to add more, instead of blindly averaging every day. The results, drawdowns and equity curve are all historical and hypothetical, based on this specific stock, this timeframe and this rule-set. They are meant purely for learning how such a framework can work – not as a promise or guarantee of future performance.