Vedanta Demerger: The Deep-Dive Investment Report
NCLT has cleared the 1:5 Split. We analyze 20 years of history, 5 new balance sheets, and the global commodity cycle to tell you exactly what you are buying.
📑 Executive Summary: The “Value Unlock” Thesis
The conglomerate discount is real. Vedanta Limited currently trades at a valuation significantly lower than the sum of its parts. By splitting into 5 listed entities, Anil Agarwal aims to mirror the success of the Adani Enterprises demerger (2015), where spun-off entities (Adani Green, Trans, Power) created massive shareholder wealth.
The Catch? Debt. The parent company (Vedanta Resources) has $6.4B in debt. How this debt is allocated to the new “Pure Play” companies will determine their fate. Below is the forensic analysis of each new giant.
1. Vedanta Aluminium (The Crown Jewel)
Verdict: STRONG BUY / HOLD | Valuation Potential: High PE (Metal Sector)
📜 History & Acquisition Context
Vedanta didn’t build this from scratch alone. The cornerstone was the 2001 acquisition of BALCO (Bharat Aluminium Company) from the Govt of India, a landmark privatization deal. Over 2 decades, they expanded capacity from ~100 KTPA to over 2.3 MTPA.
🏭 Asset Map
- Jharsuguda (Odisha): The world’s largest single-location aluminium smelter (1.8 MTPA).
- BALCO (Chhattisgarh): Integrated plant (51% stake).
- Lanjigarh (Odisha): Alumina refinery (feeding the smelters).
- Mines: Recent wins in Jamkhani and Radhikapur (Coal) and Sijimali (Bauxite) are game changers for cost reduction.
💰 Financial & Operational Health
Aluminium is the heavy lifter. In FY24, it contributed roughly 35-38% of the group’s EBITDA. However, it is cost-sensitive. The Cost of Production (CoP) hovers around $1,700-$1,800/t. With LME Aluminium prices at ~$2,400/t, the margin safety is healthy.
2. Vedanta Oil & Gas (The Cash Machine)
Verdict: DIVIDEND PLAY | Valuation Potential: Low PE (Sunset Industry)
📜 History: The Cairn Saga
Acquired in 2011 from Cairn Energy PLC (UK) for ~$8.6 Billion. It was later merged into Vedanta Ltd in 2017 to use its cash pile to service group debt. Now, it is being spun out again.
🏭 Asset Map & Reserves
- Rajasthan (Barmer): The Mangala, Bhagyam, and Aishwariya (MBA) fields. India’s largest onshore find.
- Ravva (Andhra): Mature offshore field.
- Cambay (Gujarat): Tight oil/gas potential.
- Contribution: Produces ~25% of India’s domestic crude oil.
⚠️ The Critical Issue: Reserve Replacement
Oil fields naturally decline. Cairn’s production has been stagnant/declining. They are investing in EOR (Enhanced Oil Recovery) polymers to squeeze more oil out, but this increases cost per barrel ($12-$15/barrel opex). Without a major new discovery (OALP blocks), this is a depleting asset.
3. Vedanta Power (The Dark Horse)
Verdict: SPECULATIVE / WATCHLIST
⚡ The Strategic Pivot
Historically, Vedanta’s power units were “Captive” (meant to run their Aluminium plants). The demerger changes them into “Merchant” power producers who sell to the grid for profit.
🏭 Portfolio (Approx 5GW Total)
- Talwandi Sabo (TSPL) – Punjab: 1,980 MW Supercritical plant.
- Jharsuguda IPP – Odisha: 600 MW.
- Athena (Chhattisgarh): 1,200 MW (Recently acquired distressed asset).
- Meenakshi (Andhra): 1,000 MW (Recently acquired distressed asset).
The Opportunity: India faces a power deficit. Merchant power rates on exchanges (IEX) have hit ₹6-₹10/unit in peak summer. If Vedanta turns around the distressed assets (Athena/Meenakshi), this company could see explosive earnings growth.
4. Vedanta Steel (The Underdog)
Verdict: HIGH RISK / CYCLICAL
📜 The IBC Entry
Vedanta entered steel by acquiring Electrosteel Steels (ESL) in 2018 via the Bankruptcy code. It was a distressed asset turnaround play.
🌍 The “Hidden Gem” – Liberia
While the Indian steel plant (Bokaro) is small (1.5 MTPA) compared to Tata/JSW, the real story is Western Cluster Limited (Liberia, Africa).
It holds massive Iron Ore reserves. Vedanta plans to ship this ore to India and sell globally. If the Liberia logistics are solved, this company transforms from a small steel player to a global iron ore miner.
5. Vedanta Limited (The Safe Haven)
Verdict: CORE PORTFOLIO HOLDING
💎 What Stays Behind?
This will be the holding company. Crucially, it retains:
- Hindustan Zinc (64.9% Stake): The world’s 2nd largest Zinc miner. Lowest cost producer. Zero Debt. Cash rich.
- Vedanta Base Metals: Copper (Tuticorin – currently shut) and Zinc International (Africa).
- New Ventures: Semiconductor & Display Glass business (Avanstrate).
📊 The Investment Thesis
Without the heavy debt of Aluminium and Steel projects, Vedanta Ltd becomes a pure Dividend Yield Machine. It will receive dividends from HZL and pass them to shareholders. If the Semiconductor fab actually happens, this stock has a “Tech Valuation” upside.
🏆 The Final Scorecard: Where to Invest?
Based on asset quality, debt profile, and future growth, here is our proprietary rating for the 5 emerging stocks.
*Ratings are based on current commodity cycles and debt visibility. Subject to change post listing.
🔮 Strategic Prediction: Who Wins?
The Institutional Playbook (Smart Money Flow)
When the listing happens, expect the following churn in the first 30 days:
- Selling Pressure: Funds (FIIs/DIIs) with strict ESG mandates will dump Vedanta Oil & Gas and potentially Vedanta Power (coal-heavy).
- Buying Pressure: Funds looking for “Green Metal” exposure will aggressively accumulate Vedanta Aluminium.
- The Value Trap: Retail investors often buy “Steel” because the share price looks “cheap” (low nominal value). Avoid this. Steel needs scale to survive.
🚀 Stay Ahead of the Listing Day!
We track the Grey Market Premium (GMP) and Institutional movement daily. Don’t trade blindly.
👉 Watch Daily Market Shorts Here
Impact of US Product Boycott on Indian Listed Companies
A researched risk-map of companies most exposed if India bans U.S. products
Most Exposed (with why)
- Redington Ltd — Major distributor for Apple in India; Apple was ~27% of its revenue.
- Varun Beverages (VBL) — PepsiCo’s key bottling/franchise partner in India.
- Devyani International — Franchisee for KFC & Pizza Hut; exclusive Costa Coffee partner.
- Sapphire Foods India — Operates KFC, Pizza Hut, Taco Bell.
- Westlife Foodworld — McDonald’s master franchisee (West & South India).
- Jubilant FoodWorks — Master franchisee for Domino’s; also runs Popeyes.
- Tata Consumer Products (Starbucks JV) — 50:50 JV with Starbucks.
- Colgate-Palmolive (India) — Subsidiary of Colgate-Palmolive (US).
- P&G Hygiene & Health Care — Listed Indian arm of Procter & Gamble (US).
- Abbott India — Subsidiary of Abbott Laboratories (US).
- 3M India — Flagship listed company of 3M (US).
- Honeywell Automation India — Indian listed arm with U.S.-origin products.
- Oracle Financial Services Software — Subsidiary of Oracle (US).
- Netweb Technologies — Manufactures servers with NVIDIA platforms.
Second-order Risks to Watch
- Electronics/IT hardware ecosystem relying on Intel, AMD, NVIDIA, Microsoft stacks could face severe disruption and cost spikes.
📉 Don’t Settle for Average Growth.
HDFC gives you stability. We give you Financial Freedom.
- ✅ Algo Execution: Zero emotions, 100% discipline.
- ✅ Nifty + Gold: The ultimate hedge strategy.
- ✅ Passive Wealth: No screen time required.
Join The 17% Club
UNLOCK THE STRATEGY ➔Start compounding your wealth today.
US Tariffs, Market Panic, and India’s Opportunity: A Data-Backed Reality Check for Investors
The stock market world is buzzing after the announcement of reciprocal tariffs by the US President on April 2, 2025. Many are calling it the new “Black Monday,” and global indices are reacting violently. But before we dive into panic mode, let’s take a balanced look at what’s really going on—and what it means for Indian investors.
Two Paths Ahead for the US
- Postponement or Negotiation:
Over 50 countries have reportedly approached the US to reconsider the tariff implementation. A diplomatic pause could be justified in favor of global trade stability. - Stick to the Plan:
Domestic pressure from businesses, citizens, and international leaders may build up. Yet, if the administration is determined, they might proceed—at least until certain insiders have benefited (as rumors suggest).
“There are whispers that key players close to the US administration hold put options and bonds—profiting from the current fall. Once they exit, the bullish momentum may resume.”
When Charts Don’t Help, Experience Does
- In high-volatility situations, neither technical nor fundamental analysis gives a clear signal. ⚠️
- Experience, data analytics, and emotional control become your greatest assets.
- Market panic, like in COVID-19 2020, feels overwhelming—but always finds equilibrium.
Hong Kong’s 10% Crash: Why It’s an Overreaction
- A single-day 10% fall is extreme—but markets never go to zero.
- Corrections, even if steep, find a bottom before reversing.
“We can’t predict tomorrow. But we can prepare.”
Eye-Opening Global Trade Data
- Global goods & services: $33 trillion
- Global manufacturing: $1.5 trillion
- US Imports: $3.3 trillion
- US Exports: $3 trillion
If tariffs continue, the US risks losing $2.9 trillion in trade value—an unsustainable hit.
Don’t Panic. Learn Instead.
If you’re feeling scared about the fall, it’s likely due to:
- Lack of risk management
- Poor money management
- Not having a tested strategy ️
WhatsApp “PRO” on +91 9726 000 826 to become a professional stock market trader.
Global Reaction to US Tariffs
- Europe: Ready to retaliate with tariffs on services like Amazon, Google, Microsoft.
- Vietnam: Planning to reduce US import tax to 0% to avoid confrontation. ️
- India: Negotiating a bilateral trade agreement with the US.
- Russia: Largely irrelevant due to minimal trade volume with US.
Catching a Falling Knife or Opportunity of a Lifetime?
This is the question every investor must ask. But here’s our view:
- Use data, not fear
- Look for value, not just lower prices
- Be cautious, but don’t miss long-term opportunities
Indian Markets: A Beacon Amid Chaos
- On April 7, 2025, at 11 AM, most Indian stocks were trading above opening prices.
- This isn’t a sign of value buying—but definitely profit-booking and resilience.
“India VIX has reached 2020 levels. That means massive volatility—but also massive opportunity.”
⛽ Crude Oil: Don’t Rush In
- Crude below $60/barrel puts pressure on OPEC
- OPEC will likely cut production soon ️
- Don’t trade crude on MCX without professional risk management.
Why India is in a Sweet Spot
- India’s export to the US = Only 2% of our GDP
- India is a net importer of crude
- Lower oil = Lower import bill = Helps reduce trade deficit
This is exactly why global investors are bullish on India—not just now, but for the long run.
Final Thoughts: Leadership & Investor Mindset
- The importance of choosing strong leadership in India cannot be overstated.
- This is a test of patience and preparation, not panic.
- Learn, adapt, and invest with logic—not emotion. ❤️
“You’ve now witnessed two major global crises in five years. If you learn from them, your future is secure.”
Warren Buffett once said:
“Be fearful when others are greedy and greedy when others are fearful.”
Summary of Key Takeaways
- US tariffs could hurt the global economy, but India is shielded to a large extent
- Market volatility = opportunity for prepared investors
- Don’t catch a falling knife, but don’t miss out either
- ⛽ Crude oil strategy needs planning, not impulse
- Focus on data, not drama
Final Call
Stay alert, stay informed, and stay invested—with India.
For more insights and strategies, follow us or WhatsApp “PRO” on +91 9726 000 826 to join our trading education community.
📉 Don’t Settle for Average Growth.
HDFC gives you stability. We give you Financial Freedom.
- ✅ Algo Execution: Zero emotions, 100% discipline.
- ✅ Nifty + Gold: The ultimate hedge strategy.
- ✅ Passive Wealth: No screen time required.
Join The 17% Club
UNLOCK THE STRATEGY ➔Start compounding your wealth today.
Introduction
The stock market is a double-edged sword. While some stocks create massive wealth over time, others destroy fortunes in no time. Understanding the biggest wealth creators and destroyers helps investors make informed decisions. This blog provides a deep dive into the top-performing stocks of FY24-25, their absolute returns, and why investing in growth sectors is crucial.
What is Absolute Return?
Absolute return measures the total percentage gain or loss of an investment over a specific period, independent of any benchmark or index comparison. It provides a clear view of how much wealth an investment has generated, making it a crucial metric for evaluating stock performance.
Few of Biggest Wealth Creator Stocks (Case Study: Absolute Returns)
Below is a list of stocks that delivered staggering absolute returns, showcasing their wealth creation potential:
M&M – 4,208%

Bharti Airtel – 16,455%

UltraTech Cement – 4,518%

K.P.R. Mill – 5,080%

Bajaj Finance – 4,36,270% (Unparalleled growth in financial sector)

Supreme Industries – 14,296%

Que: Where to see all video + blog of 15 Free Strategies?
https://whatsapp.com/channel/0029Vab80Xa1CYoS1FVQLU27
Top Wealth Destruction Stocks


These numbers indicate that choosing the right sector and stock can lead to exponential growth.
Top 5 Reasons to Trade Only in Growth Sectors
1. Consistent Wealth Creation
Growth sectors attract high institutional interest, ensuring long-term price appreciation.
2. Economic Resilience
Industries such as technology, finance, and healthcare show strong resilience against economic downturns.
3. High Innovation & Expansion
Growth companies reinvest profits into R&D, leading to continuous innovation and expansion.
4. Attracts Smart Money
Institutional investors focus on high-growth sectors, leading to steady demand and liquidity.
5. Compounding Effect
Long-term investments in growth sectors benefit from compounding, maximizing wealth creation.
Top 47 Sector Leaders
Here’s a breakdown of sector-leading stocks that dominate their industries:
- Energy: Reliance Industries
- Retail: Avenue Supermarts
- Cement: UltraTech
- Restaurant: Jubilant Food
- Footwear: Metro Brands
- Textiles: K.P.R. Mill
- Paints: Asian Paints
- Alcohol: United Spirits
- Credit Card: SBI Cards
- Beverage: Tata Consumer
- Hospitals: Apollo Hospitals
- Housing Finance: HDFC
- Telecom: Bharti Airtel
- NBFC: Bajaj Finance
- Diagnostic: Dr. Lal PathLabs
- IT Services: TCS
- Bank: HDFC Bank
- FMCG: Hindustan Unilever Ltd
- Job Search: Info Edge
- Hotels: Indian Hotels
- PSU: SBI
- Electric Vehicle: Tata Motors
- Gold Loan: Muthoot
- Infra: L&T
- Luggage: V.I.P. Industries
- Paper: JK Paper
- Mutual Funds: HDFC AMC
- Industrial Chemical: Gujarat Fluorochem
- Plastic Products: Supreme
- Beauty: FSN E-Com (Nykaa)
- Wedding Wear: Vedant Fashions
- Steel: JSW Steel
- Power Producer: NTPC
- Renewable: Adani Green
- Industrial Product: Siemens
- Auto Ancillary: Bosch
- Chemicals: SRF
- Internet Biz: Zomato
- 4 Wheeler: Maruti Suzuki
- Pharma: Sun Pharma
- Luxury Goods: Titan
- Aerospace & Defense: HAL
- Motorcycle: Eicher Motors
- API & Life Sciences: Divi’s Labs
- Airlines: InterGlobe
- Agro Chemicals: UPL
- Logistics: Delhivery
Conclusion
Investing in the right sector is the key to wealth creation in the stock market. By focusing on growth sectors and analyzing absolute returns, traders and investors can maximize their gains while mitigating risks. The market rewards those who make informed choices—so study sector leaders, monitor trends, and execute strategies smartly!
Introduction to the Zig Zag Indicator
What is the Zig Zag Indicator?
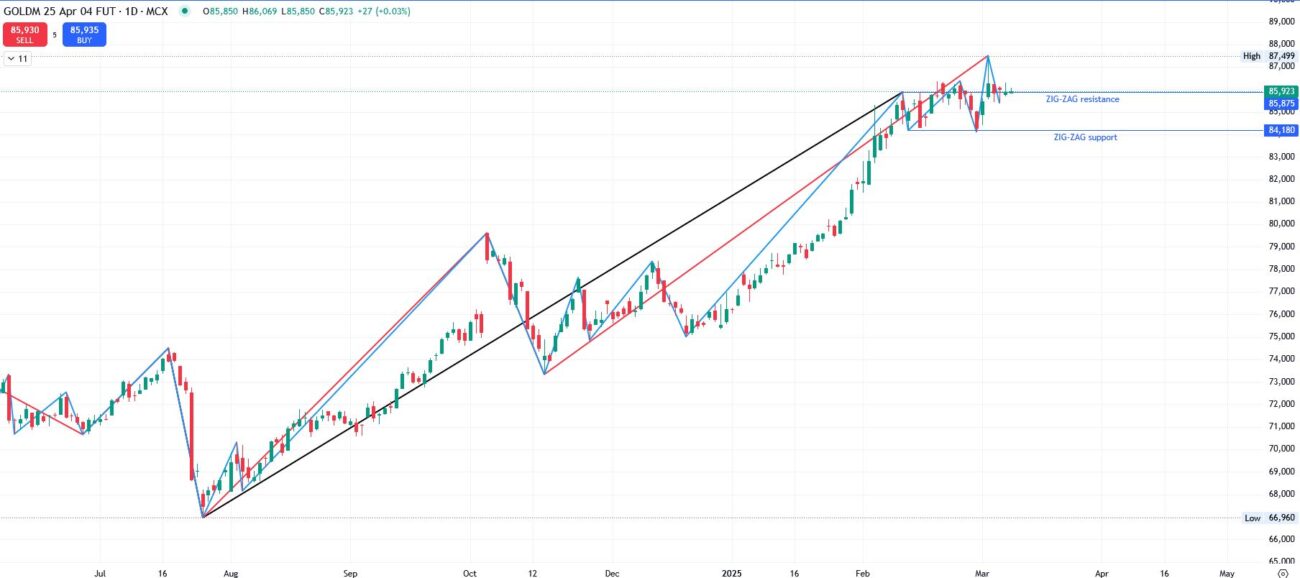
The Zig Zag indicator is a technical analysis tool designed to filter out market noise and highlight significant price movements. It helps traders identify trends, reversals, and key price levels by connecting swing highs and swing lows on a price chart. Unlike traditional trend indicators, the Zig Zag indicator does not predict future price movements but rather refines past price action to provide clarity.
Why is the Zig Zag Indicator Important?
- Trend Identification: It helps traders focus on the dominant trend while filtering out minor fluctuations.
- Clearer Chart Analysis: By eliminating market noise, it provides a cleaner chart for better decision-making.
- Trade Confirmation: When combined with other indicators like moving averages and Fibonacci retracements, it enhances trade accuracy.
- Entry and Exit Signals: It provides structured trading signals based on pre-defined parameters.
Understanding Your Zig Zag Strategy
Chart Timeframes & Zig Zag Values
- 15-Minute Chart: Used for trade execution.
- Daily Chart: Used to confirm the broader trend.
- Zig Zag Parameters:
- 2/2 Value: Used for entry and exit points.
- 5/5 Value: Used for re-entry signals.
- 10/10 Value: Used for long-term trend analysis.
Supporting Indicators for Enhanced Accuracy
- Moving Averages: Used for trend confirmation.
- Fibonacci Retracement (50%): Used to set realistic price targets.
Practical Applications and Case Studies
Using the Zig Zag Indicator in Trades
- Entry and Exit Strategy (2/2 Value)
- Identify a trend using the daily chart.
- Enter a trade when the Zig Zag indicator confirms a reversal on the 15-minute chart.
- Exit when the indicator signals another reversal.
- Re-Entry Strategy (5/5 Value)
- If a strong trend is confirmed, re-enter the trade when the 5/5 Zig Zag line corrects and resumes in the primary trend direction.
- Long-Term Trend Strategy (10/10 Value)
- Use the daily chart with 10/10 settings to confirm long-term trends for positional trades.
- Plotting support and resistance
- Since high/ low is visible, plotting support and resistance becomes easy.
Setting Targets with Fibonacci Retracement (50%)
- Once an entry is confirmed, apply Fibonacci retracement to measure potential price pullbacks.
- The 50% retracement level serves as a realistic target for profit-taking.
Risk Management (Optional)
- Stop-Loss Placement: Below the recent swing low for long positions and above the recent swing high for short positions.
- Risk-Reward Ratio: Maintain a 1:2 or better risk-reward ratio for sustainable profits.
Trading Psychology & Mindset
- Patience is Key: Wait for proper confirmations before entering trades.
- Avoid Emotional Trading: Trust your strategy and follow predefined rules.
- Consistency Over Perfection: No strategy guarantees 100% success; focus on consistent execution.
Conclusion & Final Thoughts
- The Zig Zag indicator is a powerful tool for filtering market noise and refining trading decisions.
- When combined with moving averages and Fibonacci retracement, it provides highly effective trade setups.
- Success with the Zig Zag indicator requires discipline, risk management, and continuous learning.
By mastering this approach, traders can improve their market timing and boost their overall profitability.
Thanks & Regards,
Office of Mitul Mehta
www.mitulmehta.in | +91 9726 000 826

3 Powerful Chart Patterns Every Trader Must Know
To improve your trading skills, you must understand these key chart patterns where most traders fail. You will learn to make better trading decisions, reduce risk, and identify strong entry points. In this blog, we’ll discuss three important patterns:
- Catching a Falling Knife – How to avoid unnecessary losses by avoiding the wrong price for averaging.
- Bottom Formation – How to catch a stock before it rallies.
- Accumulation as per Dow Theory – How to recognize institutional buying on the daily chart.
1️⃣ Catching a Falling Knife
Many traders make the mistake of buying a stock when it is crashing, desperate to average without support. But this can be dangerous if the stock continues to fall which leads to mental trauma.
❌ What’s the Risk?
- A stock in free fall can drop even lower.
- Traders enter too soon without confirmation, blocking capital.
- Weak hands panic and sell, pushing prices even lower.
✅ How to Use This Pattern Correctly?
- Wait for a reversal signal – Do not buy just because a stock is down.
- Look for strong support levels – and wait for price to react to this level’s.
- Watch for confirmation indicators like M2B, Magic volume or bullish candlestick patterns.
Best Advantage: If executed correctly, you can buy a stock at its lowest point resulting in higher returns on investment. Here patience is the key!
Watch this special YouTube video to see real examples: Click Here
2️⃣ Bottom Formation
A stock forming a strong bottom signals that it is about to reverse its downtrend. Smart traders look for early signs of a bottom formation to enter before a big price surge.
✅ Why is this Pattern Important?
- Helps avoid fake rallies and weak recoveries.
- Lets you buy low before a strong uptrend starts.
- Reduces the risk of entering too early in a falling market.
How to Identify a Bottom Formation?
✔ Higher Lows after a price fall is an early sign.
✔ Volume Increase indicates interest at price.
✔ Technical Indicators like M2B.
Best Advantage: You get an early entry before the stock moves higher, ensuring maximum profits with minimal downside risk.
Want to see real market examples? Watch this special YouTube video: Click Here
3️⃣ Accumulation as per Dow Theory
Dow Theory explains how markets move in phases, and Accumulation is the phase where big investors quietly buy before a major uptrend begins.
Why is the Accumulation Phase Important?
- Indicates institutional buying.
- Price stays in a narrow range before a breakout called accumulation after a downtrend
How to Spot Accumulation on a Daily Chart?
✔ Stock moves sideways in a tight range with above-average volume.
✔ High Volume but candles are not bullish.
✔ No new lows despite bearish market conditions.
Best Advantage: Once accumulation is complete, stocks usually enter a strong uptrend, giving high returns with low risk.
Learn how to identify accumulation with real charts in this YouTube video: Click Here
Must-Watch: Dow Theory Secrets by Expert Mitul Mehta!
This YouTube lecture reveals powerful Dow Theory concepts that most traders ignore. If you truly want to understand market movements, this is a must-watch!
Scan Stocks Like a Pro!
Manually finding these patterns can be time-consuming. Use our Financial Scanner to: ✅ Spot accumulation phases automatically. ✅ Identify stocks forming bottoms. ✅ Save hours of research time!
Try it now: Explore Here
Coming in the Next Mitul Mehta Email (26-Feb-2025)
A powerful stock market compounding strategy to build long-term wealth! Stay tuned!
Email “join” to support@xpertnifty.in
Your Turn – Let’s Discuss!
Have you used any of these patterns in your trading? Which one do you find the most reliable?
Hit reply and share your thoughts!
Follow me on Twitter for daily market insights: Click Here
If you found this blog valuable, share it with your trading friends! Let’s grow together.
To your success,
www.mitulmehta.in | +91 9726 000 826
A FIRE (Financial Independence Retire Early) Calculator is a tool designed to help individuals plan and calculate how much money they need to save and invest in order to achieve financial independence and retire early.
The concept behind FIRE is based on the idea of saving and investing aggressively so that your investments generate enough passive income to cover your living expenses, enabling you to retire before the traditional retirement age of 60 or 65.
FIRE Calculator https://xpertnifty.in/fire-calculator/
Key Concepts in a FIRE Calculator:
- Annual Expenses: The calculator requires the user to input their expected annual expenses. This is the amount of money they need to live comfortably each year, covering everything from housing to food to entertainment.
- Expected Annual Return Rate: This refers to the anticipated average return on investments, typically from stocks, bonds, mutual funds, or other financial vehicles. The return rate plays a major role in how quickly the user’s investments grow.
- Savings Rate: The percentage of the user’s income that they plan to save and invest each year. A higher savings rate means they are putting a larger portion of their income towards their FIRE goals, which can lead to early retirement.
How the FIRE Calculator Works:
- FIRE Number: The calculator typically uses the 25x rule. This rule suggests that you should aim to save 25 times your annual expenses to achieve financial independence. The FIRE number is the amount of money you need to have invested so that the passive income generated by that investment is enough to cover your living expenses.
- Formula: FIRE Number = Annual Expenses × 25
- Time to FIRE: The calculator also estimates how long it will take to reach your FIRE number based on your savings rate and the expected rate of return on your investments. This is calculated by determining how many years of investing are required for your savings to grow to the required amount.
- Formula: Time to FIRE = Log(FIRE Number / Annual Savings) / Log(1 + Return Rate)
FIRE Calculator https://xpertnifty.in/fire-calculator/
Example:
- Suppose your annual expenses are ₹500,000, and you expect an annual return rate of 8% on your investments. If you save 50% of your income (₹250,000), the calculator would estimate how long it will take to accumulate 25 times your annual expenses (₹12,500,000).
The FIRE Calculator will give you two key pieces of information:
- FIRE Number: The amount you need to retire comfortably.
- Time to FIRE: The number of years it will take to reach financial independence based on your current savings rate and return expectations.
Benefits of Using a FIRE Calculator:
- Goal Setting: Helps you set realistic financial independence goals based on your lifestyle and expected returns.
- Plan and Strategy: Offers insights into how much you need to save and invest regularly to retire early.
- Tracking Progress: Allows you to track whether you’re on track with your savings and investments to retire early or if adjustments need to be made.
Conclusion:
A FIRE calculator is a powerful tool for individuals interested in pursuing early retirement. By understanding how much you need to save and how long it will take, you can develop a strategy to reach financial independence and retire earlier than the traditional retirement age.